
31 August 2026


Reading time [minutes]: 18


Biotech and Diagnostics Innovation

PCR and artificial intelligence in infectious diseases: where clinical value may emerge

From amplification curves to surveillance: algorithmic functions, required evidence and the limits of the ‘AI-driven’ claim.


Abstract

Context
In PCR, deterministic automation, machine learning, cloud connectivity and epidemiological dashboards perform different functions. Grouping them under the ‘AI-driven’ label makes the inputs, outputs and decisions that the software can influence less clear.

Evidence
Analysis of complete curves can support quality control and the flagging of anomalous results in the settings studied. Transferability to other assays, instruments, matrices and populations, however, requires external validation; process and epidemiological surveillance also depend on consistent metadata, denominators and governance.

Implications
Operational or clinical value depends on the intended purpose, data quality, uncertainty management, human oversight and control of updates. The algorithm falls within the quality system and the applicable regulatory perimeter; it does not replace them.

Snapshot

Deterministic automation
Software that applies predefined rules, for example by invalidating a run when a required control fails to amplify.

Machine learning on the curve
A model that recognises patterns in the fluorescent signal; performance must be demonstrated for the intended assay, platform and population [2,4].

Intended purpose
The stated function of the software, with its inputs, outputs, users, population, context of use and the decision it influences clearly defined [4,11,12].

External validation
Verification on independent data and under representative conditions, including instruments, lots, sites, matrices and subgroups that the model will encounter in its intended use [4,6–8].

Change control
Governance of versions, modifications and updates, including impact assessment, acceptance criteria, monitoring and the ability to fall back [4,9,10].

Introduction

In molecular diagnostics, ‘artificial intelligence’ can refer to very different objects: a curve classifier, a multi-site quality-control system, an interface that prioritises cases for review, or a dashboard that aggregates already validated results. The distinction affects the type of error that may occur, the evidence required and the responsibility associated with the output.

This Insight distinguishes three levels—signal interpretation, process surveillance and epidemiological interpretation—and examines them through applications in infectious diseases. More than establishing whether AI is ‘better’ than conventional interpretation, the task is to understand when an algorithmic function becomes assessable, verifiable and useful without concealing uncertainty.

1. A PCR system does not become intelligent when it is connected

The ‘AI-driven’ label is applied to different phenomena: a thermocycler connected to the cloud, an automatically calculated threshold, software that verifies controls, a machine-learning model that classifies a curve, and a dashboard that displays the geographical distribution of positive results. These are potentially useful functions, each requiring different evidence.

A rule that invalidates a run when the internal control fails to amplify is deterministic automation: the criterion is predefined and the software applies it. A model that learns from thousands of curves to distinguish plausible signals, artefacts and uncertain cases belongs to machine learning. A map that aggregates already validated results does not interpret the test; instead, it supports epidemiological interpretation. Treating all three levels as ‘AI’ increases the impact of the claim and reduces the ability to assess them.

The useful question concerns the input received by the algorithm, the output produced, the decision influenced and the expected behaviour in the event of an error. This is the step that brings the discussion back from marketing to diagnostics.

2. The curve contains more information than a single number

Real-time PCR generates a time series of fluorescence measurements. The Cq—the cycle at which the signal crosses a threshold—condenses that dynamic into an operational value, but it does not on its own describe shape, slope, background noise, plateau, control behaviour or interactions between channels. MIQE 2.0, a guideline for reporting qPCR experiments, requires transparency regarding pre-analytics, assay design, efficiency, limits of detection and quantification, controls and raw-data availability [1]. It is not a standalone standard for clinical validation; it does, however, make what the workflow measured and documented verifiable, which is also a necessary condition for assessing an algorithm.

A frequently cited example is qPCRdeepNet, a model developed to interpret fluorescence readings from a SARS-CoV-2 assay without relying exclusively on Cq. In the dataset studied, analysis of the complete curve showed potential as a quality-assurance tool and for identifying anomalous results [2]. The finding confirms that the signal contains usable patterns, but it remains limited to that assay and those conditions: transferability to another assay or thermocycler, a different matrix, or a pathogen with different dynamics must be demonstrated.

This is where a decisive boundary lies: in diagnostics, strong retrospective performance on internal data begins validation; it does not complete it.

3. First level: interpreting the signal without concealing uncertainty

The most direct use case concerns curve classification. A model can assist in distinguishing positive, negative, invalid or uncertain results; recognise patterns incompatible with the expected amplification; highlight late or irregular curves; and recommend priority review. In multiplex panels, it can also consider relationships between targets and controls instead of assessing each channel in isolation [2,4].

The potential operational benefit is consistency: in high-volume laboratories and multi-site networks, a well-validated system can apply the same criterion and make exceptions more visible. The correct verb, however, remains ‘assist’. The meaning of the result also depends on what the curve does not show: contamination, sample quality, inhibition, stage of disease, therapy, prevalence and patient history [1,3,4].

A study of highly automated NAAT platforms for SARS-CoV-2 estimated a very low proportion of false positives in the cohort analysed; the authors nevertheless limited the generalisability of the estimate to other settings [3]. When prevalence is low, even rare errors can affect the probability that a positive result is truly positive. Software can recognise an unusual curve; the missing clinical information remains unresolved.

A robust workflow retains a category of uncertainty. Forcing every case into ‘positive’ or ‘negative’ may appear efficient, but it removes from review precisely those samples that require repetition, an orthogonal method or specialist assessment [4].

4. Second level: monitoring the process beyond the individual result

AI can observe series of runs and different sites to recognise changes that an individual test does not reveal: an increase in invalid results, a shift in the Cq distribution, rising noise in one channel, or differences between lots, instruments or operators. At this level, the unit of analysis becomes the process rather than the individual patient [4].

Connectivity and standardisation are crucial. Comparing data from a network requires consistent metadata: software version, reagent lot, instrument, assay, matrix, extraction procedure, controls, environmental conditions and technical interventions. Without this structure, the model may detect a variation without knowing whether it represents an analytical problem, an epidemiological change or a simple workflow modification [1,4].

The distinction between biological and technical drift is particularly important in infectious diseases. An increase in positivity may indicate an outbreak, contamination or a new criterion for referring samples. A mutation in the target may reduce assay performance; a reagent change may alter curve shape. An alert is useful when it leads to a reproducible investigation, not when it merely produces more notifications [1,4].

International good machine learning practice principles therefore indicate datasets representative of the intended use, adequate separation of training and test sets, assessment of human–AI interaction, clear information for users and lifecycle monitoring [4]. The algorithm operates within the quality system, without replacing its responsibilities and controls.

5. Third level: from validated results to surveillance

A network of distributed tests can generate a useful geotemporal flow. By aggregating results with date, location, target and reference population, analytical tools can recognise unexpected changes, clusters or geographical differences. The potential benefit concerns the timeliness of collective interpretation, not the accuracy of the individual PCR test [5].

Epidemiological quality, however, depends on the denominator. Ten positive results can mean different things if they come from twenty tests in symptomatic people, one thousand screening tests, or a newly activated site. If access, sampling criteria or capacity change, the observed series changes too. Reviews of AI early-warning systems highlight problems involving data volume, granularity, availability, bias and adaptability [5]. Without context, a dashboard turns testing into a map, but not necessarily into surveillance.

Minimum clinical data, access rules, interoperability, information protection and a clear separation between the individual result and aggregate use are therefore required. Data speed becomes valuable only if authorities or healthcare organisations have thresholds, expertise and procedures for acting [5].
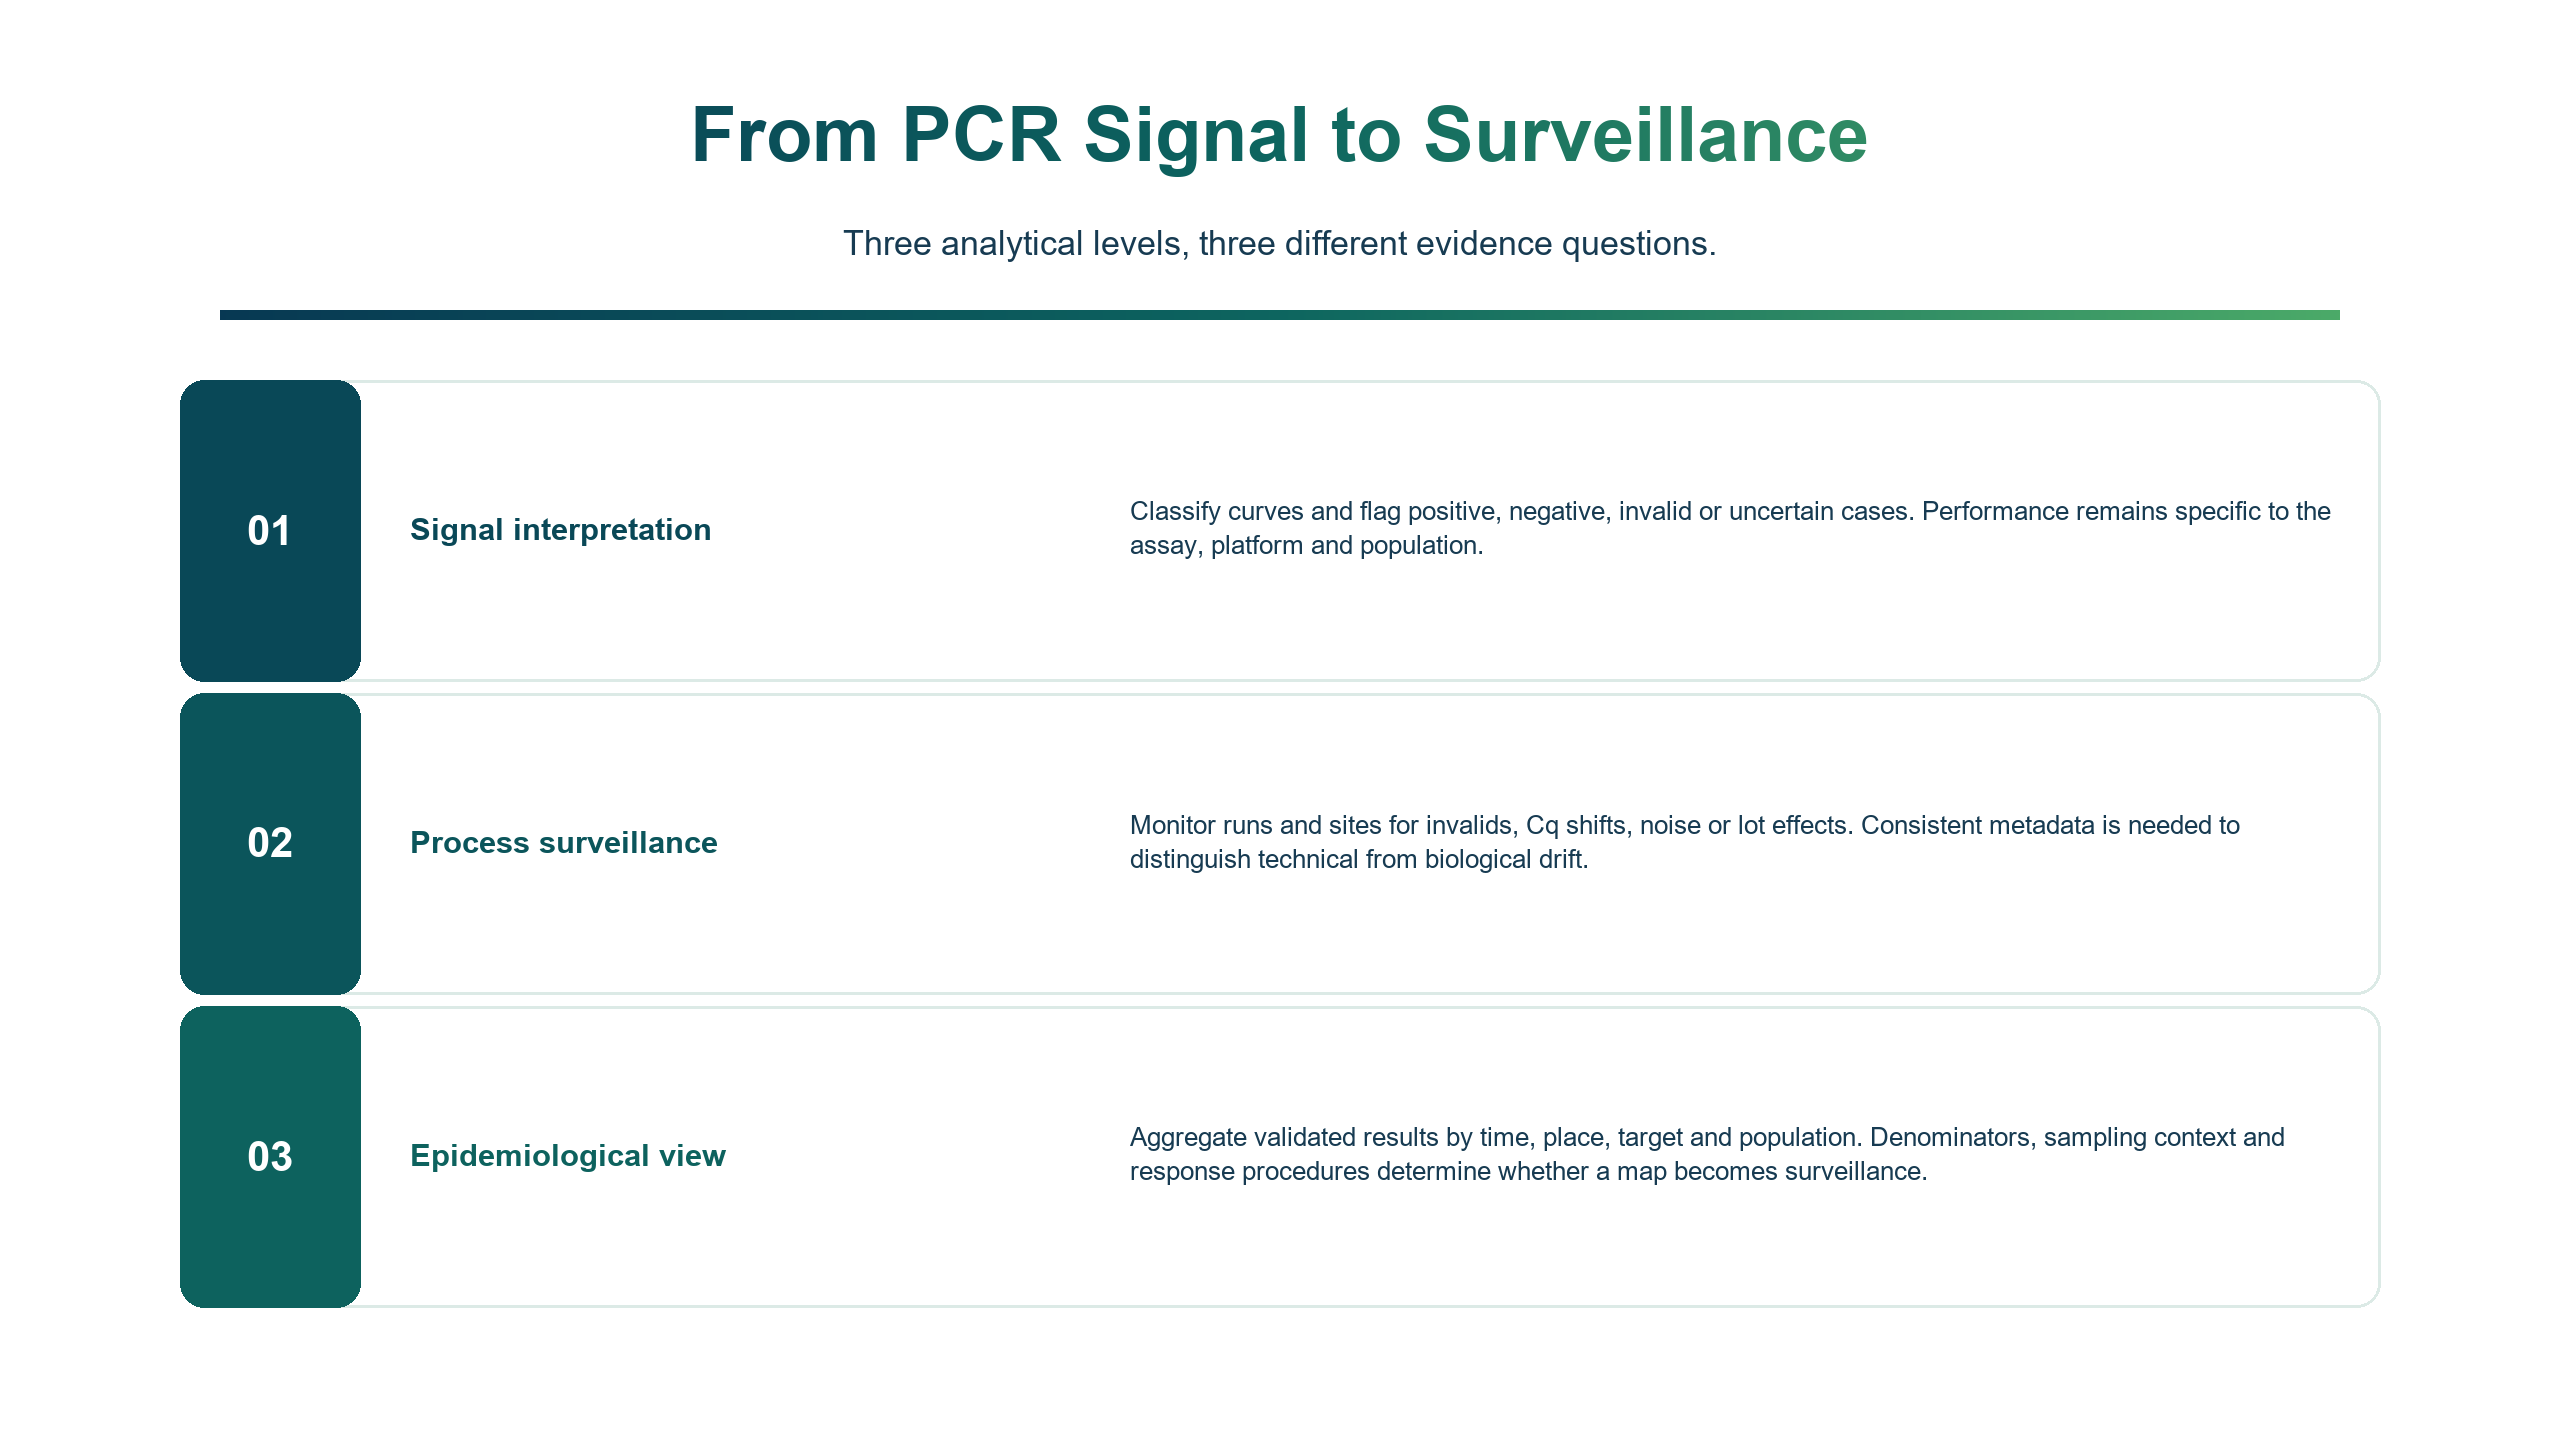
Three-level table distinguishing PCR signal interpretation, process surveillance and epidemiological interpretation, with the function, evidence and context required for each.

6. Three use cases, three levels of maturity

In respiratory infections, automated curve analysis can help manage high volumes and multi-target panels. The qPCRdeepNet study demonstrates feasibility in the dataset and assays assessed, without establishing general transferability [2]. External validation across seasons, variants, sites and different prevalences therefore matters more for adoption than an isolated accuracy percentage.

In sexually transmitted infections, the use case should be defined by taking account of co-infections, low-concentration targets and different clinical consequences. An algorithm can make the application of criteria and the review of controls more consistent; it cannot turn a detected target into active disease without considering the matrix, natural history, diagnostic window and applicable guidelines. These are conditions to be verified in the intended purpose, not a benefit that has already been demonstrated [1,4].

For potential use in sepsis or hospital-acquired infections, the assessment must extend beyond curve interpretation to include collection, volume, preparation, concentration of the agent, contamination and the distinction between colonisation and infection. Faster classification alone does not demonstrate an improvement in sample-to-answer time or outcomes. AI can be assessed for triage and process control. Any clinical benefit must be demonstrated across the complete workflow and against endpoints defined in advance [1,4,6–8].

A practical rule emerges: the greatest value does not always coincide with the most spectacular algorithmic function. Flagging an anomalous run early or avoiding an unnecessary repeat may be more useful than generating a complex interpretation.

7. Validating the algorithm means validating the chain

A credible assessment begins with the intended use: population, sample, assay, instrument, operator and decision. Data and metrics follow from these variables. Sensitivity and specificity may not be sufficient; calibration, subgroup performance, behaviour in out-of-distribution cases, the human override rate, concordant and discordant errors, time saved and the consequences of errors must also be considered [4,6–8].

TRIPOD+AI, CONSORT-AI and SPIRIT-AI are reporting guidelines, not validation standards. They make models, protocols and trials more transparent by requiring descriptions of the data, the intervention, human–AI interaction and errors [6–8]. The principle is also useful in diagnostics: the evidence must allow the model to be assessed as a component of a pathway, without attributing to these checklists a regulatory or validation function they do not have.

External validation must include conditions that the model will actually encounter: different instruments, new lots, operators, matrices, co-infections, prevalences and varying sample quality. After release, it is necessary to observe whether the data distribution changes. A ‘locked’ model can lose performance; an updatable model introduces the opposite problem, because each change can alter the risk profile [4,9,10].

In 2025, the FDA proposed a total product lifecycle approach for AI-enabled software functions in a draft guidance; in the same year, it published final guidance on predetermined change control plans for planned modifications [9,10]. The two documents have different statuses, but they converge on one operational point: learning and updating require transparent versions, limits, monitoring and change control.

8. Augmented diagnostics is a boundary discipline

Applied to PCR, AI can add value to data that are currently compressed, discarded or observed too late. It can make interpretation more consistent, identify weak signals in the process and connect a network. Its value increases when the boundary between what the algorithm knows and what requires context remains visible [2,4,5].

For a laboratory or healthcare network, asking ‘do you have AI?’ is of little use. An assessment should instead establish which errors the function is intended to reduce, on which data it has been validated, how it manages uncertainty, what it shows the user, how it is monitored and which decision it is intended to support. The answers distinguish a digital function from a diagnostic capability [4,9,10,12].

FAQ

Can an algorithm replace a biologist or physician in PCR interpretation?

It can automate criteria and assist classification within a validated use. Uncertain cases, clinical context and the consequences of the decision require professional responsibility, understandable information and a defined fallback [4,8,12].

Does AI make PCR more sensitive?

It does not automatically change the chemistry, limit of detection or sample quality. It can make better use of signal shape or flag artefacts, but the benefit must be demonstrated for the specific assay, platform and population [1,2].

Is a results dashboard equivalent to epidemiological surveillance?

No. Denominators, sampling criteria, data quality, interoperability, governance and response procedures are required. Visualisation is an interface; surveillance is a system [5].

How is an algorithm intended for multiple assays, instruments or sites validated?

Independent data representative of the conditions of use are required, with analyses by instrument, lot, matrix, site and relevant subgroup. Out-of-distribution cases, human overrides, concordant and discordant errors and acceptance criteria must also be defined before release [4,6–8].

What changes when the model is updated?

Every modification can alter performance and risk. The version, data used, expected impact, checks and deployment conditions must be governed; for AI-enabled devices, FDA documentation on the lifecycle and PCCPs provides a regulatory reference with draft and final status respectively [9,10].

How are uncertain cases or system unavailability managed?

The workflow must retain a category of uncertainty and establish when to repeat the test, use an orthogonal method or seek specialist review. It must also provide fallback, an audit trail and operating rules for when the software or cloud is unavailable; the result must not be forced into a certain class [4,12].

Conclusions

AI-driven PCR should be understood as an architecture supporting a molecular process rather than as a standalone category of test. Its maturity is measured by how precisely it separates signal, process and population; by data quality; by its ability to state uncertainty; by external validation; and by the discipline with which updates are managed [4,9,10].

The most credible future avoids handing the diagnosis to an invisible algorithm. It focuses on systems in which automation and machine learning make the workflow more observable, direct attention to relevant cases and produce usable data. Intelligence emerges from the whole architecture, including the rules that establish when to trust, when to verify and when to stop.


Sources

[1] Bustin SA, Ruijter JM, Van den Hoff MJB, et al. MIQE 2.0: Revision of the Minimum Information for Publication of Quantitative Real-Time PCR Experiments Guidelines. Clinical Chemistry. 2025;71:634–651. DOI: 10.1093/clinchem/hvaf043. Publisher

[2] Alouani DJ, Rajapaksha RRP, Jani M, Rhoads DD, Sadri N. Specificity of SARS-CoV-2 Real-Time PCR Improved by Deep Learning Analysis. J Clin Microbiol. 2021;59(6):e02959-20. DOI: 10.1128/JCM.02959-20. Publisher

[3] Chandler CM, Bourassa L, Mathias PC, Greninger AL. Estimating the False-Positive Rate of Highly Automated SARS-CoV-2 Nucleic Acid Amplification Testing. J Clin Microbiol. 2021;59(9):e01080-21. DOI: 10.1128/JCM.01080-21. Publisher

[4] International Medical Device Regulators Forum. Good machine learning practice for medical device development: Guiding principles. IMDRF/AIML WG/N88 FINAL:2025. IMDRF

[5] El Morr C, Ozdemir D, Asdaah Y, et al. AI-based epidemic and pandemic early warning systems: a systematic scoping review. Health Informatics J. 2024;30(3). DOI: 10.1177/14604582241275844. Publisher

[6] Collins GS, Moons KGM, Dhiman P, et al. TRIPOD+AI statement: updated guidance for reporting clinical prediction models that use regression or machine learning methods. BMJ. 2024;385:e078378. DOI: 10.1136/bmj-2023-078378. Publisher

[7] Liu X, Cruz Rivera S, Moher D, et al. Reporting guidelines for clinical trial reports for interventions involving artificial intelligence: the CONSORT-AI extension. Nat Med. 2020;26:1364–1374. DOI: 10.1038/s41591-020-1034-x. Publisher

[8] Cruz Rivera S, Liu X, Chan AW, et al. Guidelines for clinical trial protocols for interventions involving artificial intelligence: the SPIRIT-AI extension. Nat Med. 2020;26:1351–1363. DOI: 10.1038/s41591-020-1037-7. Publisher

[9] US Food and Drug Administration. Artificial Intelligence-Enabled Device Software Functions: Lifecycle Management and Marketing Submission Recommendations. Draft guidance, gennaio 2025; non destinata all’implementazione. FDA

[10] US Food and Drug Administration. Marketing Submission Recommendations for a Predetermined Change Control Plan for Artificial Intelligence-Enabled Device Software Functions. Final guidance, agosto 2025. FDA

[11] Parlamento europeo e Consiglio dell’Unione europea. Regolamento (UE) 2017/746 relativo ai dispositivi medico-diagnostici in vitro. EUR-Lex

[12] US Food and Drug Administration. Clinical Decision Support Software. Final guidance, gennaio 2026. FDA